The workflow of AnnuOWL

As input, AnnuOWL needs building geometry, weather data (as *.epw file), and pre-calculated annual spectral data as (*.aowl file).
Parameters such as occupancy schedule, table height, head height, grid distribution, and thresholds for metrics to be evaluated are pre-populated with standard defaults, but are editable to match user needs. With these inputs, AnnuOWL can evaluate:
-> Grid-based CBDMs (DA, cDA, UDI) and Average illuminance through occupied hours.
-> Occupant-centered DA performance (High/Med/Min/NC) at table height using (editable) EN17037 target thresholds.
-> Occupant-centered Circadian potential as non-visual performance (High/Med/Min/NC) at eye-height in four orientations.
-> Occupant-centered Protection from discomfort glare (High/Med/Min/NC) at eye-height via (editable) EN17037 thresholds.
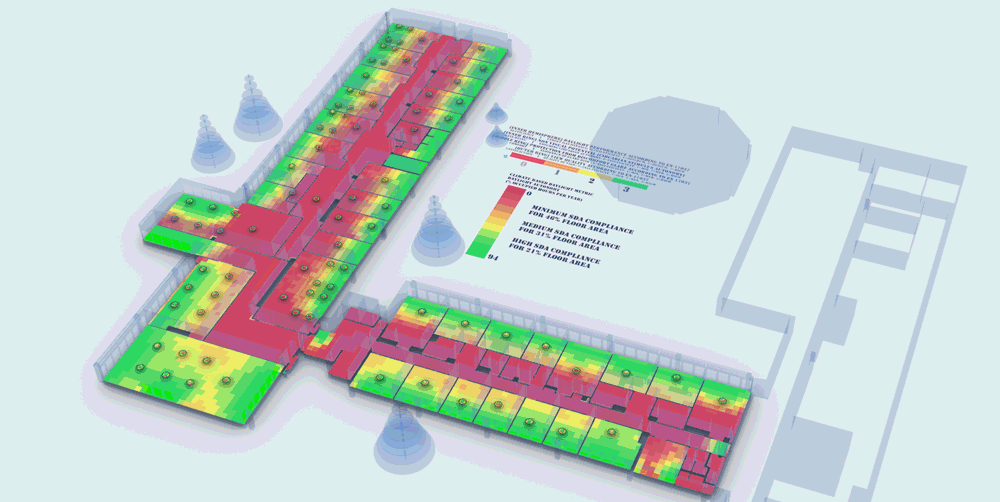
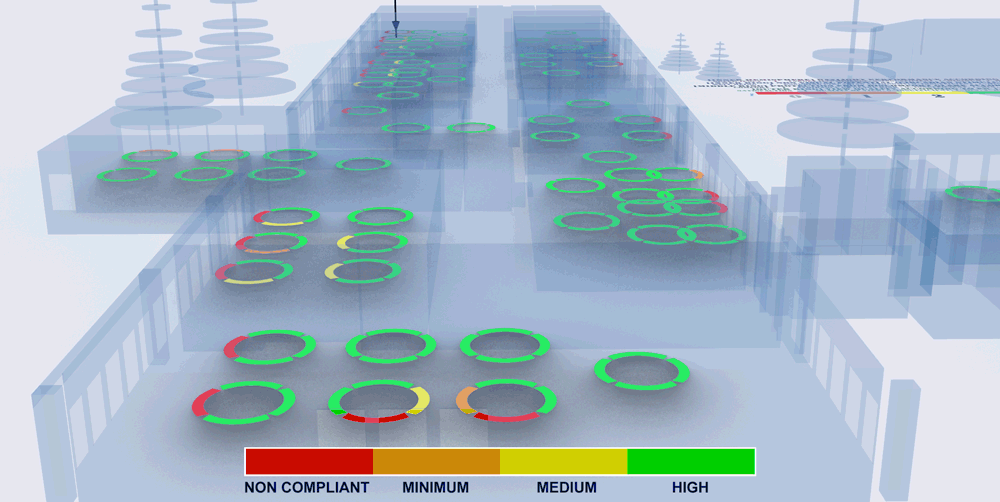
-> Annual grid-based Spatial Daylight Autonomy compliance throughout floor area (High, Minimum, Medium).
The OVNI diagrams
The OVNI diagram is an infographic placed at every occupant's position, which describes the occupant-centered annual performance of the design towards energy use, comfort, and circadian health.
Each OVNI includes a hemisphere, surrounded by three rings. Each ring is sub-divided into four segments, facing N,E,S,W orientations.
-> The hemisphere represents sufficient illuminance at table height, and uses radiance grid-based evaluation for occupied hours.
Sub-divisions on the rings represent vertical viewing positions for four principal orientations, evaluated at the occupant eye-height.
-> The inner ring represents Circadian potential & Non-visual performance, as proxy for occupant health & well-being.
-> The middle ring represents protection from discomfort glare for each orientation, and describes occupant comfort.
-> The outer ring represents view quality. This is yet to be incorporated, and will describe occupant satisfaction.
Grid: Climate-based Daylight Metrics
Using slider input, users can visualise Daylight Autonomy (DA), continuous Daylight Autonomy (cDA), useful daylight illuminance (UDI) or average illuminance through occupied hours, on a horizontal grid. With pre-populated standard default values, users can edit thresholds for CBDMs (DA, UDI_lower, UDI_upper), occupancy hours (start of business, close of business, days per week, weekend offset), and grid definition (x-spacing, y-spacing, height above floor) to match specific demands.
OVNI | Hemisphere: Daylight Provision
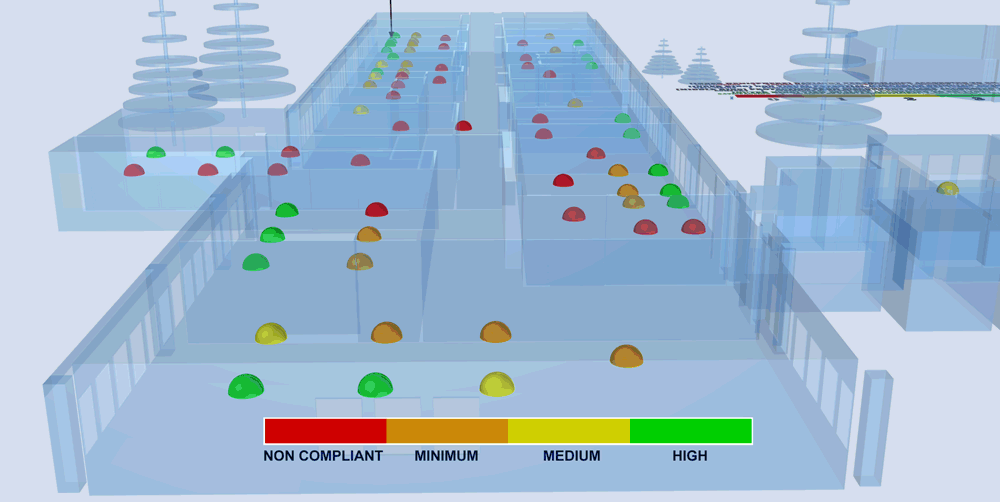
Daylight autonomy through occupied hours, in 4 bins of High, Medium, Minimum and Non-compliant is evaluated on (editable) table height. OVNI displays compliance for each location (High/Medium/Minimum, Non-Compliant) across minimum (editable) occupied hours. Defaults are EN17037 target thresholds: 750, 500 and 300 for High, Medium and Minimum, but users can edit these thresholds when evaluating for other standards, or to match future updates in the standard.
OVNI | Inner ring: Non-visual/Circadian Potential
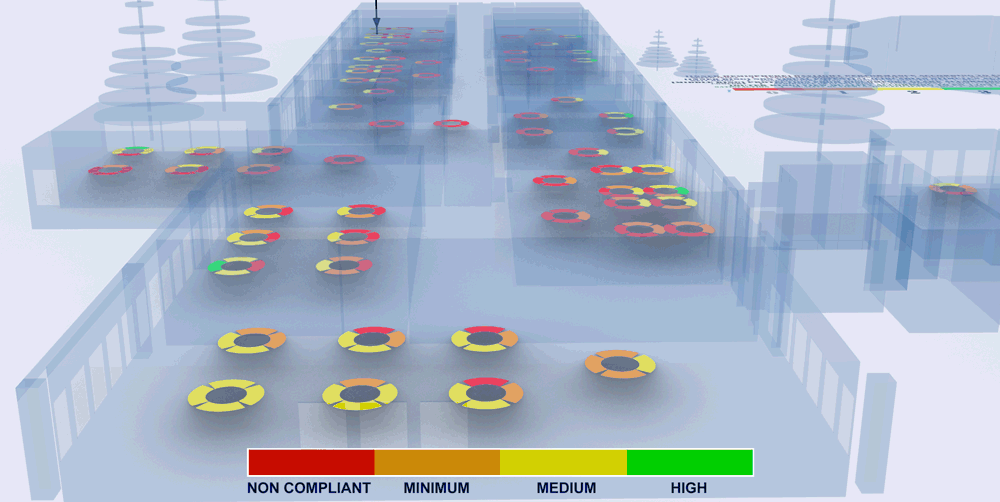
Circadian Stimulus is evaluated separately for 4 orientations for each occupant position at (editable) eye-height, via Truong's approximation, using vertical illuminance and pre-calculated hourly CIE tristimulus z value (from *.aowl file). The CS sufficiency during morning hours for every (editable) occupied day is binned into High/Med/Min/Non-Compliant based on (editable) thresholds, and the OVNI ring segments visualise compliance for each view-point across minimum (editable) occupied days.
OVNI | Second ring: Protection from Discomfort Glare
Hourly DGP is also evaluated separately for 4 orientations for each occupant position at (editable) eye-height, via simplified DGP approach, using hourly vertical illuminance. Protection from glare across (editable) occupied annual hours is binned into High/Med/Min/Non-Compliant based on (editable) EN17037 thresholds: 0.35, 0.40, 0.45, >0.45 for High/Med/Min/Non-Compliant. The OVNI ring segments visualise compliance for each view-point across minimum (editable) occupied hours.
Annual Heatmap: CS and DGP
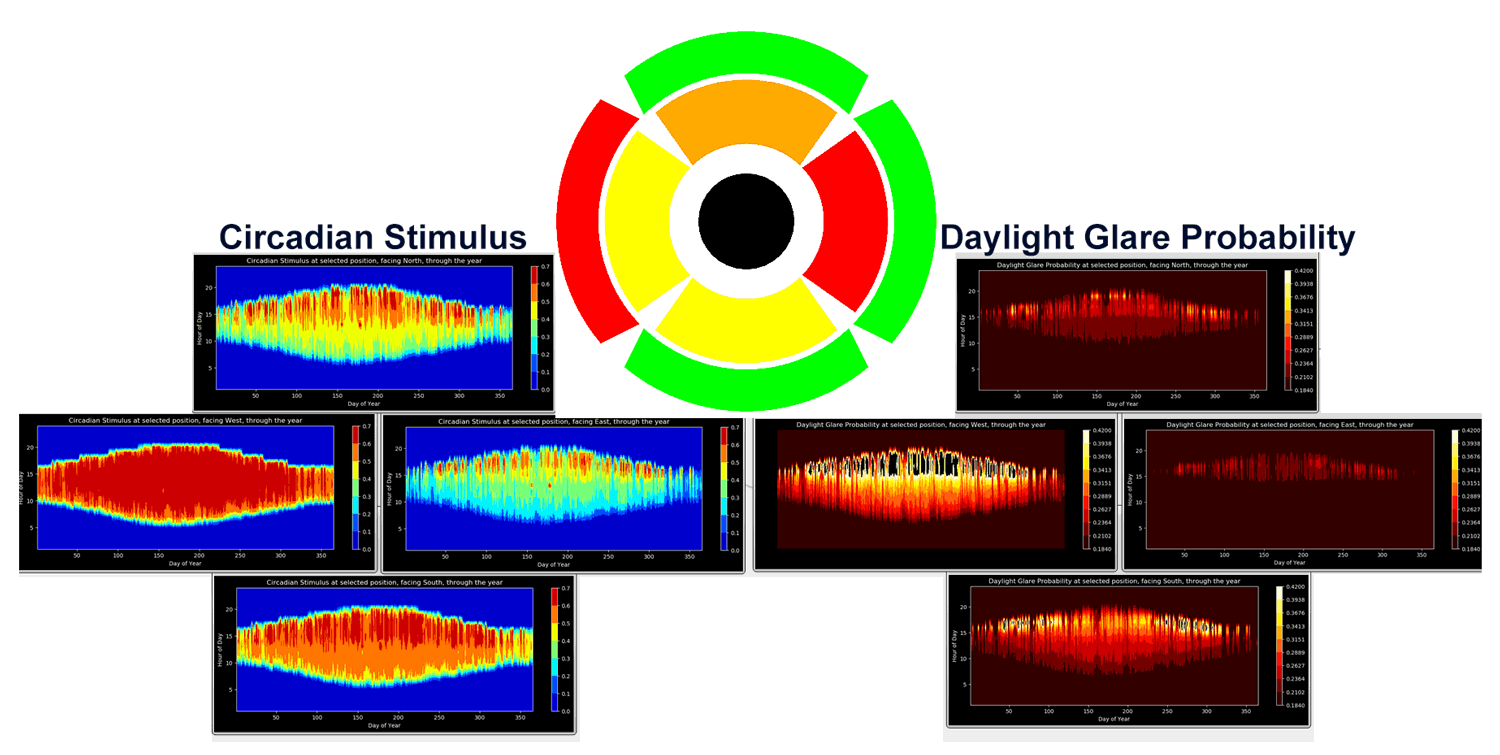
Annual heatmaps of CS and DGP can support time-specific investigations. This can help in designing facades that minimise discomfort glare at specific times, or schedule complementary circadian lighting in supplementing non-visual needs. To perform such in-depth analyses at occupant level, users can indicate occupant position-of-interest (using slider input), and AnnuOWL will generate annual hourly heatmaps (365 x 24) for CS and DGP, across four orientations for the selected position.
Legend: SDA Compliance
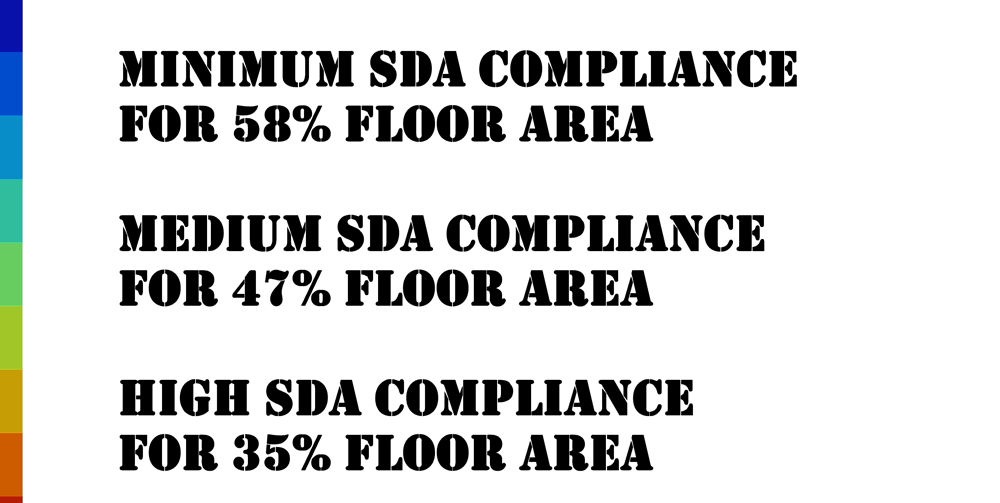
This singular grid-based compliance metric across the entire facility can be used to report the lighting performance towards sufficiency and daylight autonomy. Although with pre-populated standard defaults, occupants can modify grid definitions, occupancy hours, thresholds for Min/Med/High and definition of minimum occupied annual hours, in generating this metric. Similar metrics can also be designed for CS and DGP as 'percentage of occupants'.